

UC Davis Center for Visualization showcases capabilities
 The UC Davis Center for Visualization is breaking barriers to big data by developing advanced visualization technologies that translate complex raw data into meaningful visual representations.
The Center, led by Kwan-Liu Ma, professor of computer science, was established by a strategic seed funding program from the Office of Research called the Research Investments in the Sciences and Engineering (RISE).
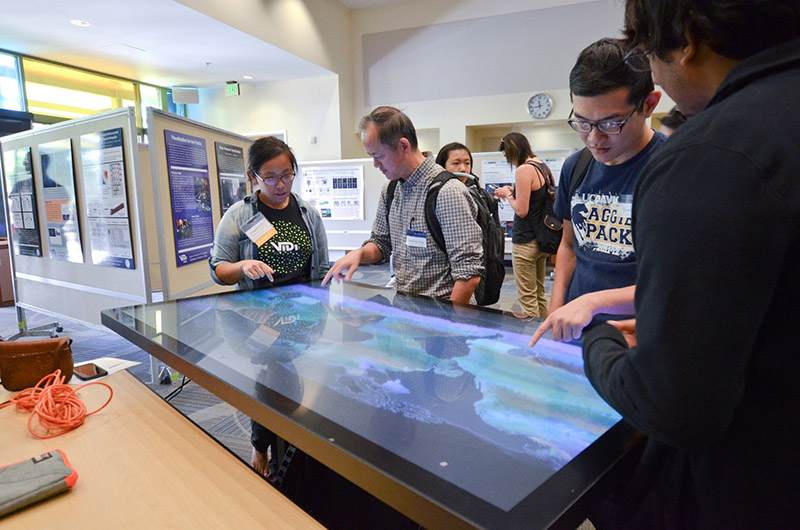
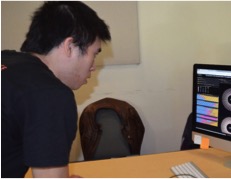
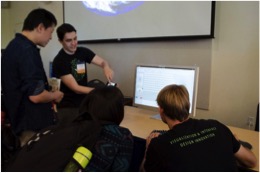
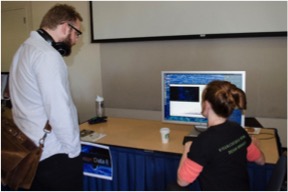
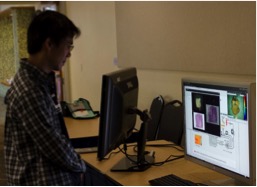
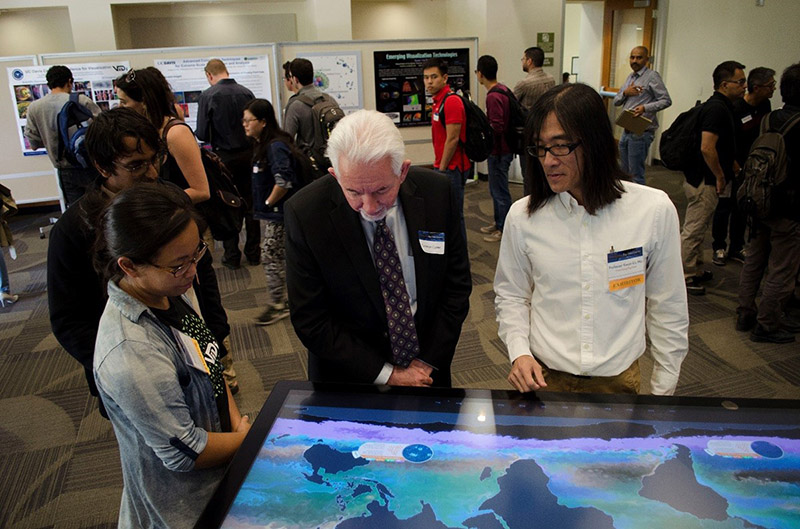
Professor Ma and his team held an interactive Big Data Demo Day on campus to showcase their work and encourage fellow researchers and students to get involved.
Over 200 attended the event, which included nine interactive exhibits to highlight how customized visualization tools can transform large and multi-dimensional data sets from various disciplines into visible and interactive representations. A variety of applications were made available to demonstrate the impact that these approaches offer.
A brief overview of each of the projects can be found below.
Please contact Professor Ma to learn more about research and education opportunities at the center.
Synteny Explorer: Using Visualization to Introduce Genome Evolution
Graduate student, Chris Bryan
Synteny Explorer is designed to introduce genome evolution to students. Interactively visualizing chromosome evolution from a common, extinct ancestor to multiple descendant species allows for optical recognition and tracking of synteny blocks over evolutionary time spans. This allows us to effectively demonstrate complex evolutionary processes, dynamically showing millions of years of evolution while actively engaging users in the learning process. The development of interactive visualization tools such as this provides opportunities to transform and enhance scientific education in genomics and other biological fields.
An Interactive System for Exploratory Visual Analysis of Healthcare Data
Graduate student, Kelvin Li
Electronic health records (EHRs) provide large amount of valuable information to clinical researchers and physicians, but there are no simple means to use the massive amount of data with high complexity and heterogeneity for improving healthcare. This team has developed an interactive visual analytics system to support exploratory analysis of EHRs for cohort study. The system is especially effective to reveal and understand the causal relationships between diseases and the correlations between patient cohorts.
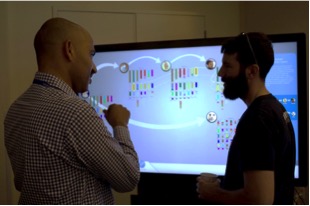
Visual Analytic System for Comparing Brain Networks
Graduate student, Takanori Fujiwara
Neuroscientists study functional connectivity between regions in a human brain to obtain a deeper understanding of how the brain functions. Since the data processed from f-MRI scans are of high complexity and dimensionality and a vast number of factors could affect brain activities, visualization becomes an indispensable tool for supporting detailed and flexible analyses of the data at multiple levels. This team designed an interactive visual analytic system that enables neuroscientists to visually compare the differences of brain networks between multiple individual subjects as well as group averages, and to manipulate the data and views to fit their constantly changing analytical needs with easy interactions. The system presents the brain network and correlation data in multiple projection spaces and with different visual representations for exploring and gaining new insights from the data.
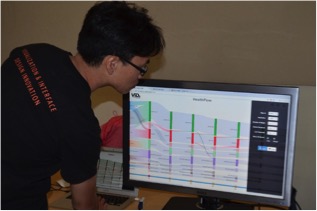
Visual Analysis of Transportation Study Data
Post doc, Jia-Kai Chou
Researchers at the Institute of Transportation Studies (ITS) collect and analyze drivers’ logs to obtain a better understanding of the general driving habits in certain geographical regions and to encourage safer and more fuel-efficient use of their vehicles. Multiple factors, such as speed, fuel consumption, harsh acceleration/deceleration, travel distance, and geo-locations, are recorded for the researchers to evaluate and understand one’s driving behaviors. In this project, the team designed and developed an interactive visual analytics system that enables researchers to cluster and compare large amounts of multi-variate driving data so as to suggest the deciding factors that may lead to better driving behavior under certain circumstances.
Immersive Graph Visualization
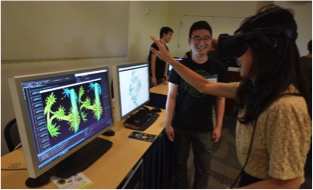
Graduate student, Oh-Hyun Kwon
Information visualization has traditionally limited itself to 2D representations, primarily due to the prevalence of 2D displays and report formats. However, there has been a recent surge in popularity of consumer grade 3D displays and immersive head-mounted displays (HMDs). While techniques that utilize such immersive environments have been explored extensively for spatial and scientific visualizations, contrastingly very little has been explored for information visualization. The team presents considerations of layout, rendering, and interaction methods for visualizing large graphs in an immersive environment.
Spatially Organized Histograms for Scientific Applications
Graduate students, Franz Sauer and Tyson Neuroth
Large-scale scientific simulations, such as those representing fusion (tokamak) devices, produce copious amounts of information. However, a lack of available tools that can efficiently aggregate and display major trends in an intuitive manner makes it difficult for scientists to study their data. As a result, this team presents a new visualization system which can display complex data distributions that vary spatially, temporally, and between different variables. They use fusion data as a driving application and show how patterns can be extracted from the large groups of particles that make up the hot plasma. This interactive software allows users to explore their data in real time through various linked views and gain a deeper understanding of how fusion systems work.
Exploring Dark Matter Evolution
Graduate student, Annie Preston
Dark matter makes up over 80% of the mass in the universe, but it cannot be seen and its composition is not known; scientists must use simulations to understand its behavior. They approximate dark matter as a group of particles that interact with one another, grouping together over time to form the vast structures that make up our universe. Working closely with scientists, this team has created an interactive visualization system that allows them to simultaneously explore the dark matter particles from their simulations and multivariate, time-dependent extracted data. Such a tool may help scientists analyze and improve their simulations, letting them pose increasingly sophisticated questions about dark matter, which is fundamental to the nature of our universe.
Visual Analysis of Image & Histologic Data
Post doc, Yi-Ling Chen
Multi-Spectral Time-Resolved Fluorescence Spectroscopy can provide label-free real-time feedback on tissue composition and pathology. However, to analyze the interrelation between fluorescence decay parameters and tissue properties taken from histological data, an accurate registration between the lifetime map and the histology slide is indispensable. This team has designed a co-registration procedure for mapping the lifetime measurements on histology slide, and also an interactive visual analytics interface for studying fluorescence and histological data, bringing new insights to clinical research.
Visualization for the Public
Caption: Graduate students, Jacqueline Chou and Keshav Dasu
Through a close collaboration with the Exploratorium, this team has developed two interactive exhibits designed around a museum experience, which is often short, episodic, and unmediated. The two interactive exhibits visualize rich data sets involving the ocean: the plankton populations in the world’s ocean and migratory patterns of marine predators in the Pacific Ocean. The visualizations are carefully designed to provide appropriate scaffolding for museum visitors to partake in scientific inquiry, which involves making comparisons and observing patterns.
Please visit http://web.cs.ucdavis.edu/~ma/ for more details and contact Professor Ma to discuss possible new collaborative opportunities.